Santiago’s public transportation system has been an expression of social and economic inequality. According to the Chilean Family Budget Survey, in Santiago, transportation is the second most significant expense in a household, followed by housing and basic services.

Low-income families can spend up to almost 30% of their salary on transportation, while within the most prosperous socio-economic level, the percentage of spending tends to be less than 2%.
The primary purpose of public transportation systems is to generate more opportunities and to provide an ease of the use of transportation systems that should be affordable and create more access to different services. When the public transportation system is poorly designed, the people living in the periphery are more affected than the ones living in the downtown.
Despite the efforts to improve the situation of many people living in the periphery -who commute every day for 2 to 3 hours - the situation has almost not changed at all in the past years.
On top of this, in October of this year (2019), the Chilean Ministry of Transportation announced a 3.75 percent fare hike for the public transit system. It was 30 Chilean pesos, less than 5 U.S. cents, but an amount that matters for low-income families who already spent a significant amount of their income in transportation.
The following project seek to explore the following research questions:
- How has accessibility changed over the last 7 years?
- Is there a relationship between these changes in accessibility and the most vulnerable people?
Data Input
Public Transportation
In 2012, the public transportation was comprised by 5 Metro lines, 108 stations and the bus route network while in 2018, it was constituted by 6 Metro lines, 118 stations a commuter rail to connect the periphery with the center of the city, and an expanded bus route network.
Points of Interest
For the purpose of the analysis we mapped educational and health facilities as point of interests, and the job density (jobs/sqkm).

Calculating Accessibility
A linear function was used to calculate the accessibility index for each zone. There are three types of Point of Interest: Health Facilities, Education Facilities, and Jobs. Each of them is summed to get the accessibility index with weights 0.5, 0.3, 0.2, for health, education, and jobs, respectively. To calculate the points reachable from a given point, a spatial function was created that uses an isochrone and all the points of interest as input. Then, for every isochrone’s cut off, the function will count the points reachable in that time.

Results
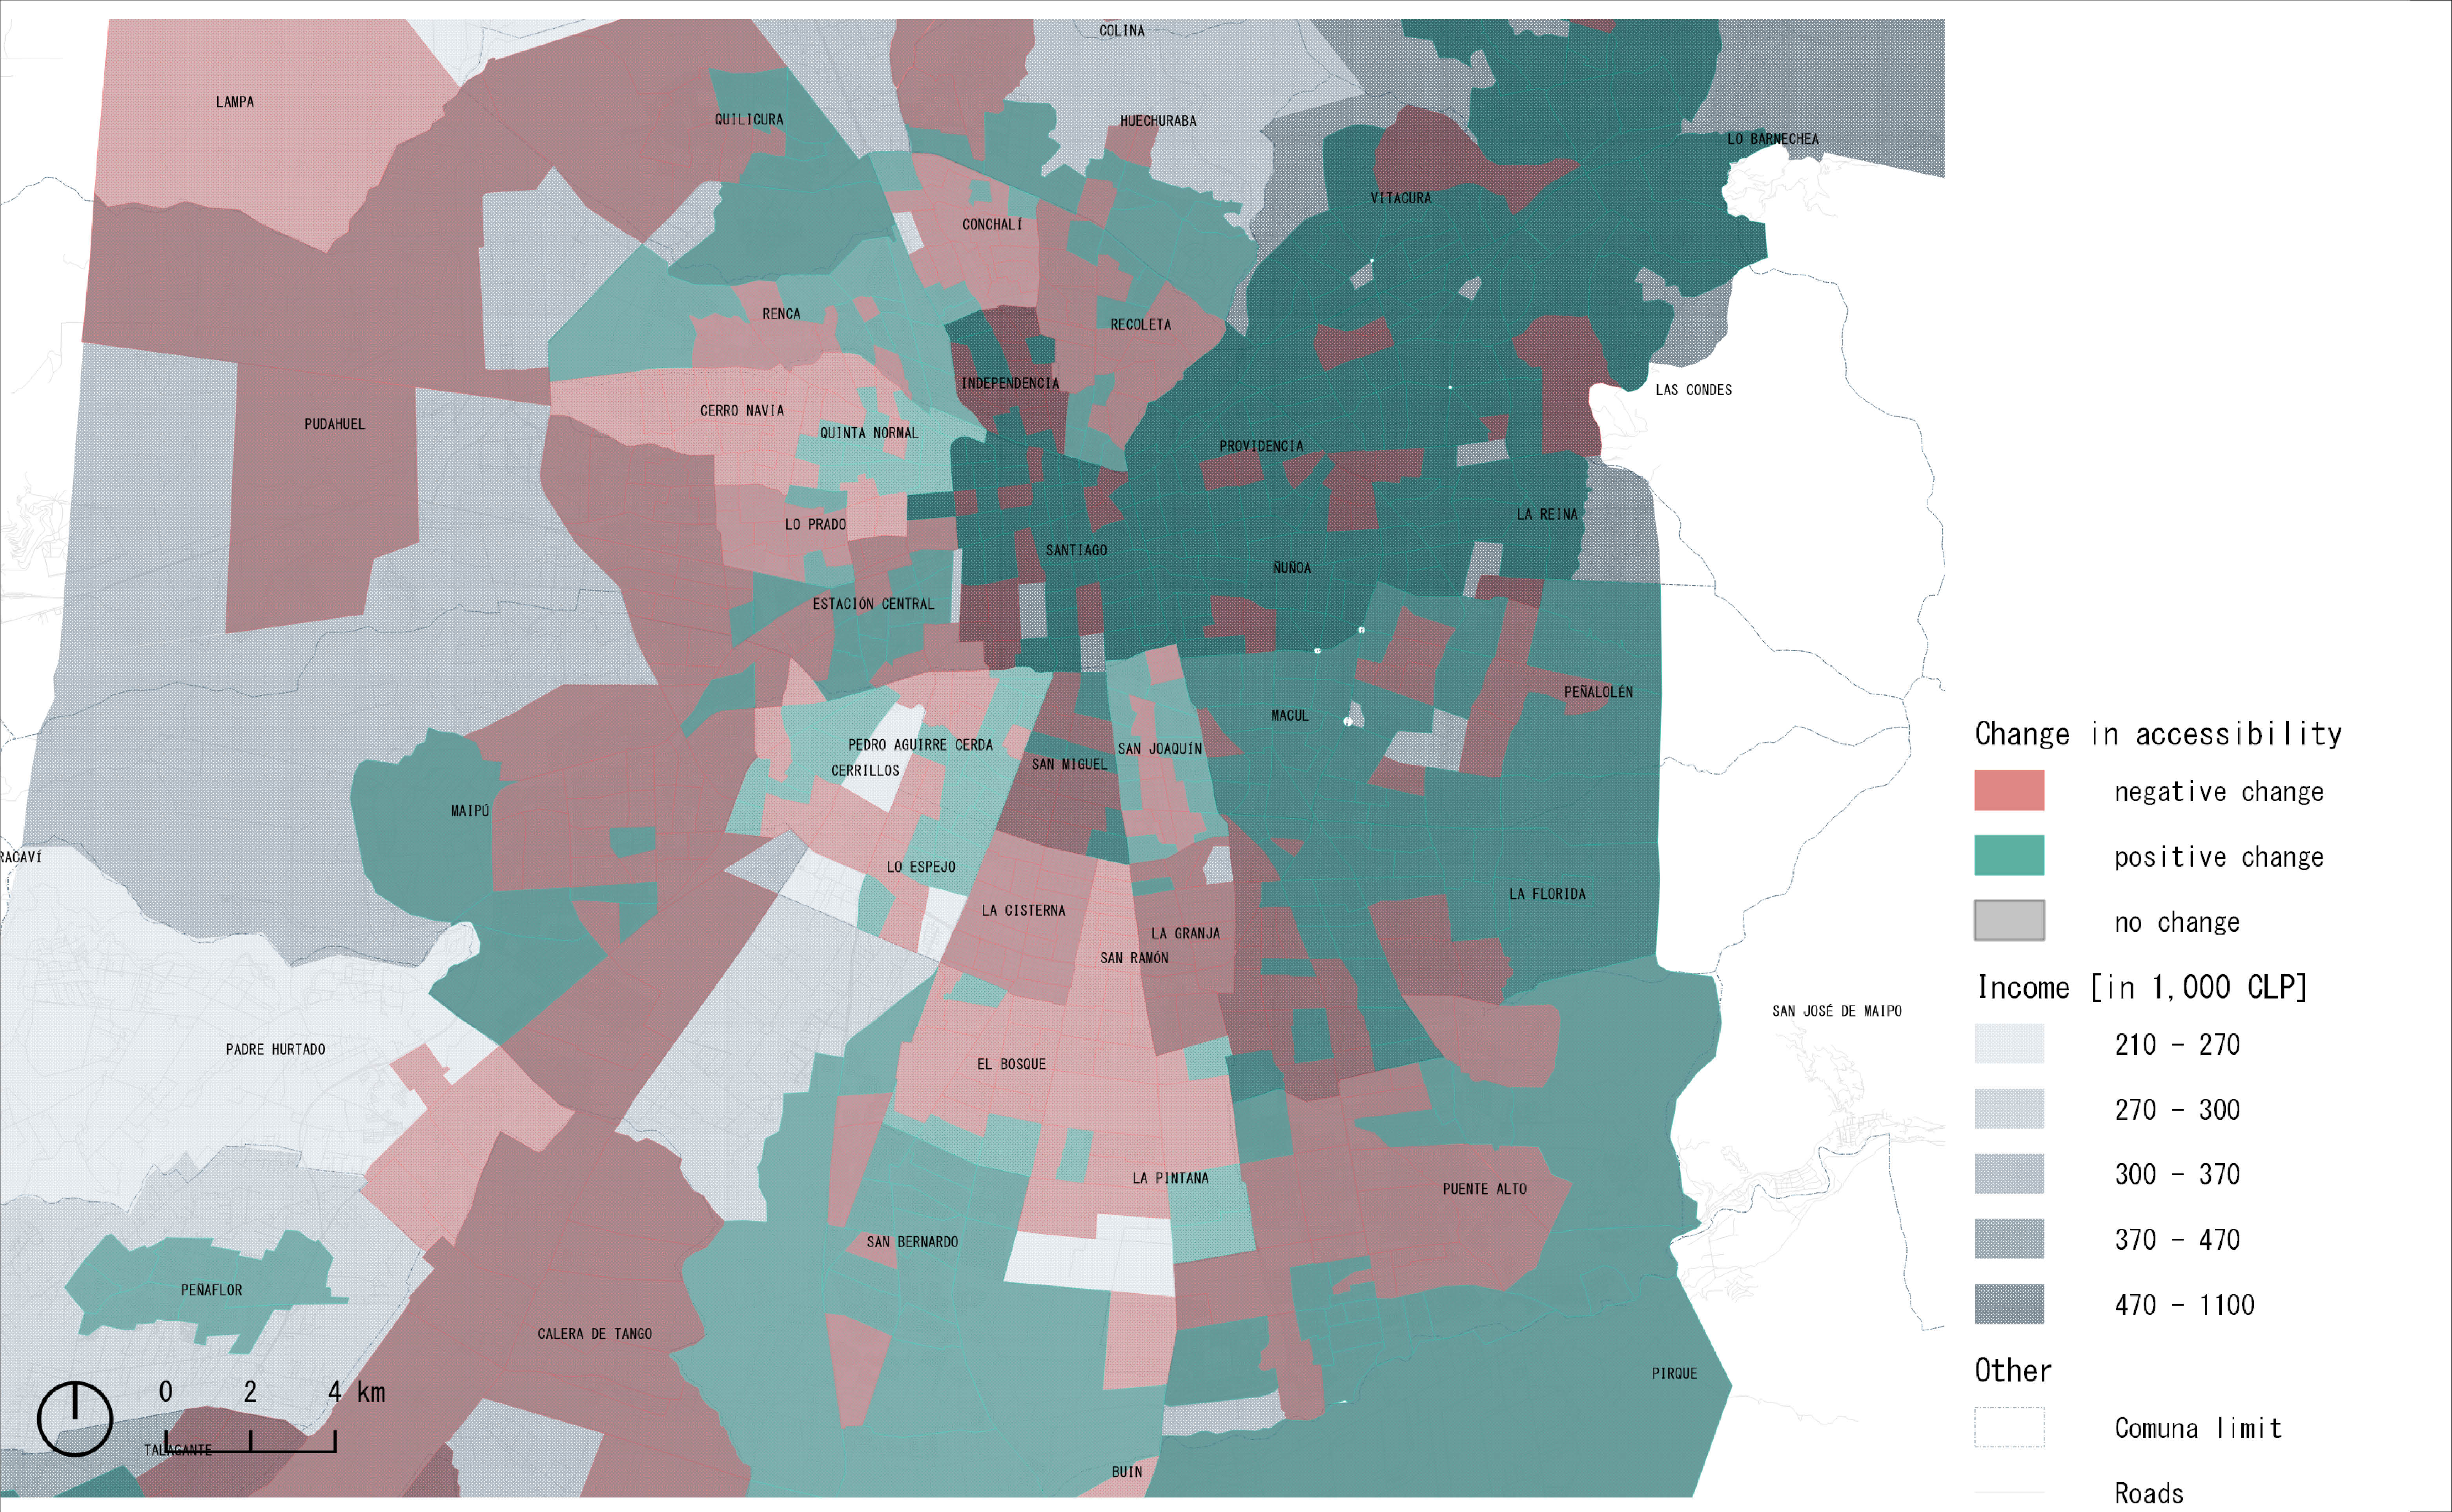
91% of the zones changed its accessibility when comparing 2012 with 2018. Many different factors could be the cause, mainly the construction of new subway lines and reorganization of the bus routes, but also because of an increase in the offer of health, education and jobs.
Additionally, while 46% of the zones changed positively, 45% decreased its accessibility. Further analysis to find the causes of these changes is needed in order to reach more accurate conclusions. However, presumably these changes can be related to variations in income per capita, and changes related to where jobs and services concentrate. Even though accessibility has improved in different areas in Santiago, it is conspicuous that is has improved more where income has grown in the same period of time.
RQ1: How has accessibility changed over the last 7 years?

RQ2: Is there a relationship between these changes in accessibility and the most vulnerable people?